Did you know Fire and Emergency New Zealand (FENZ) publish incident reports? Well they do, and you can read them here. Naturally, the software developer and “Oooo pretty graph” in me decided I wanted to look at the data, and so I created a little tool for myself to gather some information to build this post.
Disclaimer
Caveat for this data and my inferences: the data supplied is an extract from the ICAD reporting system maintained by Fire and Emergency New Zealand. It is not complete statistical data and should not be relied on for statistical analysis.
All inferences made here are my own, and simply made because I think data analysis is cool especially when it’s an org such as FENZ.
This is roughly 2 months of data and contains 14,810 data points.
Primary callout type Link to heading
It’s interesting to see that on average, we see the following trends for callouts:
- Medical callouts coming in at
3298records - False alarms coming in at
8113records - Everything else coming in at
3399records
We can then further break this out into the following:
- False alarms considered a ’non fire’ event:
1655records - Other false alarms then coming in at
6458records
Further, there is a big difference between ‘automated’ false alarm call-outs and not. I assume automated is reported as SPRNKLR, other code descriptions are ignored.
1230events reported as false alarms viaSPRNKLR’s
I also found it quite interesting that there are only 3298 records reported with FIRE as a result (NON-FIRE was excluded). It’s certainly lower than expected, although I am not entirely surprised that it is on par with medical callouts although that does surprise some people.
How the data was fetched, in order of usage.
SELECT count(*) FROM incidents WHERE result_description LIKE '%MEDICAL%'
SELECT count(*) FROM incidents WHERE result_description LIKE '%FALSE ALARM%'
SELECT count(*) FROM incidents WHERE result_description NOT LIKE '%FALSE ALARM%' AND result_description NOT LIKE '%MEDICAL%'
SELECT count(*) FROM incidents WHERE result_description LIKE '%FALSE ALARM%' AND result_description LIKE '%NON-FIRE EVENT%'
SELECT count(*) FROM incidents WHERE result_description LIKE '%FALSE ALARM%' AND result_description LIKE '%SPRNKLR%'
SELECT count(*) FROM incidents WHERE result_description LIKE '%FIRE%' AND result_description NOT LIKE '%NON-FIRE%'
Station callout frequency Link to heading
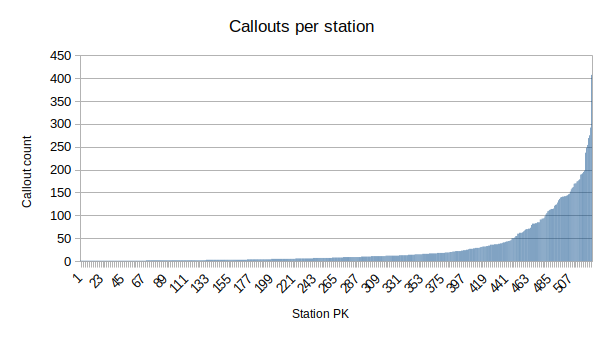
At the time writing, there are 528 stations with data points.
Of these stations, there are only 48 which have experienced more than 100 callouts in this time period. Of the top 10 stations in New Zealand by callout frequency 6 are based in Auckland.
SELECT station, count(*), avg(duration) FROM incidents GROUP BY station HAVING count(*) >= 100
Specifically, the following list is the top 10 ordered by callout frequency.
- Auckland City
- Papatoetoe
- Grey Lynn
- Parnell
- Christchurch City
- Hamilton
- Wellington City
- Manurewa
- Hastings
- Balmoral
What’s potentially even more beautiful is the sheer difference between each station with regard to callouts. For example, the Auckland City station experiences ~6.7 callouts per day while Balmoral experiences ~3.2 callouts per day. Further to this; using only the data from the top 10 stations; Auckland as a whole experiences ~27.2 callouts per day. If I were to go through the list and include all Auckland based stations, I would estimate that figure would be closer to 40 if not more.
Compounding on this, the average callout duration for an Auckland based station in the top 10 is just over 14 and a half minutes. That means with an average of ~27.2 callouts a day, over six and a half hours are spent attending calls. Again, if this data were to include other Auckland stations I’m sure it would near double.
Even better is the skew where a select few stations are taking the vast majority of calls. This is represented on the graph below.
Defence Force Bases Link to heading
Now, I couldn’t see this in the dataset and not talk about it. Who knew that incident reports for air force bases were public? Not me that’s for sure!
Looking at the data, there are three RNZAF bases with listed incident reports. I’m sure further investigation would reveal the military bases as well, however I believe they are listed under the relevant towns brigade and not a separate entry as we can see for RNZAF bases.
Of these bases, we can see 28 incident reports with a range of callout types. From false alarms to structure fires, medical airlifts (I’m assuming from the code AIRL) to mobile property fires. It’s certainly an interesting bunch of events.
How the data was fetched, in order of usage.
SELECT count(DISTINCT station) FROM incidents WHERE station LIKE '%RNZAF%'
SELECT count(*) FROM incidents WHERE station LIKE '%RNZAF%'